
The stock market can appear to have become an immense, nebulous force that is difficult to grasp. Nonetheless, these markets began modestly in Western Europe in the 15th century.
From then to now, the basic concept hasn’t changed. Yet the stock market has expanded into one of the biggest leading financial exchange mediums where people make billions and lose billions all in the same period.
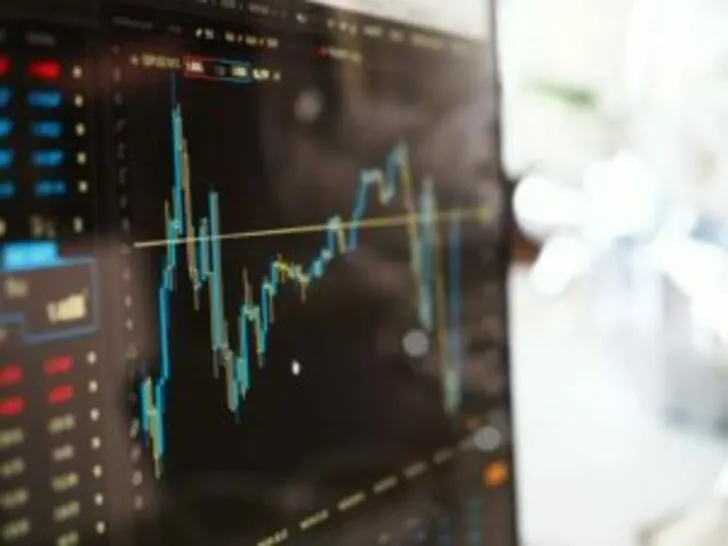
Understanding and predicting the stock market can be very daunting. Even if there are multiple tools and indexes in the modern era that help us wrap our heads around this behemoth, understanding the workings and inaccuracies of these tools is a whole task on its own.
In short, The Cboe Volatility Index (VIX) is a derived index that generates a monthly prediction of the volatility of a stock, whereas VXX is an exchange-traded note created to help investors’ exposure to the changes signified by the VIX index.
Join me as I thoroughly explain the intricacies of both the index and exchange-traded note so that you may be able to make a sound financial decision of your own.
What is the Cboe Volatility Index (VIX)?
The Cboe Volatility Index (VIX) is a real-time index that reflects the market’s expectations for the relative strength of the S&P 500 Index’s near-term price fluctuations (SPX). It generates a 30-day forward projection of volatility because it’s derived from the prices of SPX index options with near-term expiration dates.
Volatility, or the rate at which prices change, is frequently used to gauge market sentiment, especially the level of fear among market participants.
The index is far more generally known by its ticker symbol, which is often abbreviated as “the VIX.” The Cboe Options Exchange invented it (Cboe), and Cboe Global Markets maintains it.
It’s a significant index in the trading and investment world because it provides a quantifiable measure of market risk and investor sentiment.
- The Cboe Volatility Index (VIX) is a real-time market index that represents the market’s expectation of volatility over the next 30 days.
- When making investment decisions, investors use the VIX to gauge the level of risk, fear, or stress in the market.
- Traders could also trade the VIX using only a variety of options and ETPs, or they can utilize VIX values to price derivatives.
How Does the VIX Work?
The VIX aims to measure the amplitude of S&P 500 (i.e., its volatility)price movements. Higher volatility directly translates to more dramatic price swings in the index and vice versa. In addition to being a volatility index, traders can trade VIX futures, options, and ETFs to hedge or speculate on changes in the index’s volatility.
Volatility can be evaluated using two primary techniques in general. The first method relies on historical volatility, which is calculated statistically using prior prices over a specific time period.
On the historical price data sets, this process includes computing various statistical numbers such as mean (average), variance, and, finally, standard deviation.
The VIX’s second method involves estimating its value based on options prices. Options are derivative instruments whose value is determined by the likelihood of a specific stock’s current price moving sufficiently to reach a predetermined level (called the strike price or exercise price).
Because the volatility factor represents the possibility of such price movements occurring within the given time frame, various option pricing methods incorporate volatility as an integral input parameter.
In the open market, option prices are available. It can be used to derive the volatility of the underlying security. Volatility derived directly from market prices is called forward-looking implied volatility (IV).
What is VXX?
VXX is an exchange-traded note (ETN) that provides investors/traders with exposure to changes in the Cboe VIX Index via VIX futures contracts. Traders who buy VXX are anticipating an increase in the VIX Index/futures, while trades who are short VXX are anticipating a decrease in the VIX Index/futures.
In order to understand what VXX actually is. We need to take a look at its product description:
VXX: The iPath® Series B S&P 500® VIX Short-Term FuturesTM ETNs (the “ETNs”) are designed to provide exposure to the S&P 500® VIX Short-Term FuturesTM Index Total Return (the “Index”).
You’ll notice that they refer to VXX as the Series B ETN, which refers to the fact that this is Barclays’ second VXX product, as the original VXX reached maturity on January 30th, 2019.
What’s the Difference Between VIX and VXX?
In short, the iPath® S&P 500 VIX Short-Term Futures ETN (VXX) is an exchange-traded note, whereas the CBOE Volatility Index (VIX) is an index. The VXX is based on the VIX, and it seeks to track its performance.
An exchange-traded fund is backed by securities or other financial assets held by the fund’s issuer. The issuer is required to match the performance of a specific index.
In the case of VXX, the index is the S&P 500 VIX Short-Term Futures Index Total Return, which is a strategy index that holds positions in the CBOE Volatility Index for the next two months (VIX).
Take a look at this video to get a gauge of their differences.
How Does VXX Track VIX?
VXX is the ETN of VIX. ETN is a derivative-based product, as the N stands for NOTE. ETNs usually have futures contracts instead of stocks like ETFs.
Futures and options all have premiums built into them. As a result, ETNs such as VXX start out with high values only to diminish over time.
On that note, VXX doesn’t follow VIX very closely. You should only invest in ETNs for a brief moment to take advantage of the volatility at the time.
Don’t stay too long as the premium erosion in the futures contracts will cost you dearly.
VXX is an ETF based on VIX, and it attempts to track the performance of VIX.
Whereas VIX is the SPX implication volatility and directly cant be purchased or sold.
So, in most cases, VXX will indeed follow VIX.
How Do I invest in VXX?
Volatility has a huge say in intraday trading.
Since this measurement of investor sentiment regarding future volatility was introduced into the stock market, many investors have thought about the most optimum ways to trade the VIX Index.
By understanding the usually negative correlation between volatility and stock market performance, many investors have looked to use volatility instruments like the VXX to boost their portfolios.
Depending on the level of volatility, we must change our trading instrument, adjust our position sizing, and sometimes stay out of the market.
The below chart is beneficial as it helps us understand the price behavior in relation to volatility.
| Price | Volatility | Result |
| Upside | Decreasing | Good sign for the bulls. Highly Bullish. |
| Upside | Increasing | Not a good sign for trading. The range will shrink further |
| Downside | Decreasing | Not a good sign for bears. Indicates short covering. |
| Downside | Increasing | Good sign for bears. Highly Bearish. |
| Sideways | Decreasing | Not a good sign for trading, the range will shrink further |
| Sideways | Increasing | It is getting ready for the breakout or breakdown. |
This table is self-explanatory. You’ll need to befriend ‘Volatility’ in hopes of getting better results in your trading.
How High Can the VIX Go?
Briefly, the VIX could go as high as historical volatility permits, and a VIX above 120 is not improbable based on historical records.
After all, VIX is the expectation of future 1-month historical volatility.
In the past 30+ years, the VIX has:
- It remained around 4 points above the 21-day historical volatility
- keynote: with a standard deviation of 4 points
A picture is worth a thousand words.
In 2008, the VIX was calculated to be around the range of 30 and 25 points below historical volatility. Have a look at the chart illustration below.
Let’s also take the worst shock to the U.S. equity markets since 1900: the crash of ’87 – the Black Monday.
On Black Monday, the S&P 500 dropped about 25%.
Understanding VIX Historical Volatility: Insights and Analysis
In that torrid month of October 1987, the historical volatility was 94% on an annualized basis, which was higher than at any point in time during the 2008 crisis.
Applying the statistical behavior of VIX – historical volatility spread to this number, we can say that VIX will be anywhere from 60 to 120 should we have another month, like October 1987.
Now, in modern times, we have circuit breakers that will not permit such a drop.
As a result, we can argue that volatility in terms of pure short-term movement will be less severe in the future.
Bottom line
Here are the key pieces of information from this article:
- The Cboe Volatility Index (VIX) is a derived index that generates a monthly prediction of the volatility of a stock. Whereas VXX is an exchange-traded note created to help investors’ exposure to the changes signified by the VIX index.
- VXX aims to replicate VIX yet operates as an ETF with distinct market functions.
- VXX is an ETF based on VIX. It attempts to track the performance of VIX.
- Volatility can be measured using two different methods. The first method is based on historical volatility, using statistical calculations on previous prices over a specific time period.
- Understanding volatility is crucial for traders’ strategies and market behavior.
- The second method, which the VIX uses, involves inferring its value as implied by options prices.
- VIX forecasts future volatility. It aids risk assessment for informed investment decisions.
Other Articles
WHAT IS THE DIFFERENCE BETWEEN D2Y/DX2=(DYDX)^2? (EXPLAINED)
WHAT IS THE DIFFERENCE BETWEEN VECTORS AND TENSORS? (EXPLAINED)
DIFFERENCE BETWEEN CONDITIONAL AND MARGINAL DISTRIBUTION (EXPLAINED)